
Insights
Margin before marketing
What does each line keep from a new patient, before you spend to win one?
October 26, 2026
· Healthcare
· 12 min read
Growth budgets often follow volume, revenue or the loudest service line leader. Yet the line that brings in the most per new patient can keep the smallest share of it. Fund the line where what a new patient contributes covers the cost of winning one, and the schedule has room.
A hypothetical multi-site group with three service lines. Every case number below is illustrative. Payer rates use the 2024 averages the piece cites, except therapy’s commercial rate, an assumption. Therapy’s cost per visit draws on a public chain’s reported figures.
Picture the meeting that sets next year’s growth budget, where three service line leaders each want the next marketing dollar. The orthopedic clinic brings search volume, sleep medicine brings a waiting list, and physical therapy brings the most revenue per new patient. Each makes its case on volume or revenue.
The CFO needs two answers first. What does each line keep from a new patient, and can its schedule take more?
Why look past revenue?
Because payers pay very different amounts, and some services cost far more to deliver. In 2024, one large insurer’s PPO plans paid 147 percent of Medicare’s rates for clinician services, MedPAC found. Medicaid fee-for-service physician fees averaged 75 percent of Medicare’s. The commercial premium over Medicare also varies by service, and the case assumes a smaller one for therapy, 110 percent of Medicare.
So a service line’s payer mix shapes what each new patient brings in. This piece compares service lines, each with the patients it already serves.
Revenue also hides the cost to serve. Two lines can bill alike and keep very different amounts, because their visits differ in clinician time and in what that time costs. That is why the measure here is contribution, what a new patient brings in minus the cost to serve. The cost covers clinician and staff time at what it costs, plus supplies and billing. Contribution is the margin a new patient leaves to cover fixed costs and fund growth.
The case counts clinician time in every line, since sustained growth needs paid time. While a line has open slots, its next few patients cost less.
Whom you serve rests on your mission and access commitments, and those commitments can fund a line whatever its contribution. Your compliance and legal teams decide how any campaign reaches patients.
What does a new patient contribute?
In this case, the line with the most revenue per new patient keeps the smallest share of it. Therapy keeps under a third of each dollar, while the other two lines keep closer to half. Revenue per new patient is first-year visits and tests, times what each payer pays for each, weighted by the line’s payer mix.
Volume explains therapy’s revenue, and a thin margin on each visit explains its share. In the case, a therapy patient has about ten visits in the first year. In practice, each patient’s clinicians set the plan of care. Ten visits lift revenue, and they lift the cost to serve too. Each therapy visit also pays less than a visit in the other two lines.
The case takes therapy’s staff cost per visit from a public physical therapy chain’s reported figures. Its payment per visit sits below that chain’s, and that gap decides therapy’s rank in dollars. In the case, sleep medicine’s payer mix pays the most. The orthopedic clinic counts office visits only, and surgery and imaging would add to its revenue and its cost.
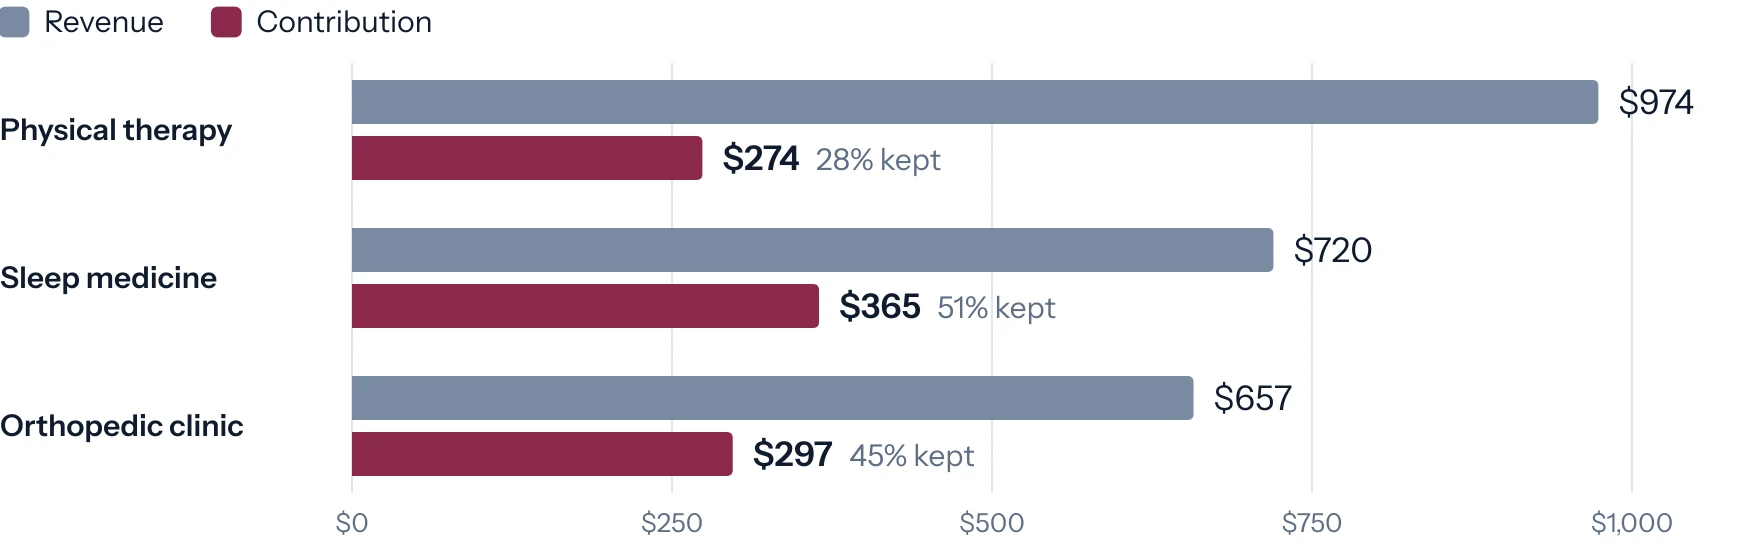
In this case, a budget that follows revenue would fund physical therapy first.
What can you afford to spend to win one?
At most, what a new patient contributes in the period you want the spend to pay back. In this case, that period is the first year. Call each line’s first-year contribution per new patient its ceiling, the most it can spend to win one. The first year is a payback test, so it sets aside later years and care in other lines, such as surgery. Lines whose patients return for years may earn a longer period.
Spend the whole ceiling, and the patient’s first-year contribution goes entirely to winning them. A target below the ceiling keeps some for fixed costs. For a growth team, the ceiling is also a defense. Spend below it pays back within the year, in terms finance already uses.
Then compare the ceiling with what each line spends today per first visit. That is its campaign spend divided by the new patients those campaigns added. The average flatters the next dollar, which, in our view, often wins fewer patients than the last. Spend per first visit also differs by line, because patients reach each one by different roads, from search to a physician’s referral.
In this case, physical therapy spends more to win a patient than one contributes in year one. The orthopedic clinic spends well under its ceiling, and on paper, sleep medicine has the most room under its ceiling. For physical therapy, we would start with the referral path, since easier sending may lower spend per first visit. Your compliance and legal teams decide how any outreach reaches referring physicians.
Is there room on the schedule?
Ask before you spend, because marketing into a full schedule buys a longer wait. A 2025 survey of six specialties in 15 major metro areas put the average wait for a new-patient appointment at 31 days. In a July 2026 MGMA poll, the largest share of medical groups reported steady new-patient waits, and more reported longer waits than shorter.
Hiring has a mixed record. Practices that hired landed in all three outcomes, and MGMA wrote that what varied was demand. Added capacity shortens waits only when it outpaces demand, and marketing adds demand.
So track an access measure for each line against a target its leaders set. MGMA lists the third next available appointment among the measures to track alongside new-patient waits. A National Academies report explains that the third open slot looks past last-minute cancellations.
In this case, each line’s target is 14 days, and sleep medicine’s wait runs well past it. Its waiting list is patients already asking for care. Its growth money goes to access first, through options its leaders weigh, such as the schedule template, staff or another clinician. When the schedule is the constraint, rank by contribution per clinician visit. Sleep medicine leads on that measure here, which carries its case for another clinician.
Capacity can mean clinicians, rooms, equipment or hours, and most take longer to add than a campaign takes to launch.
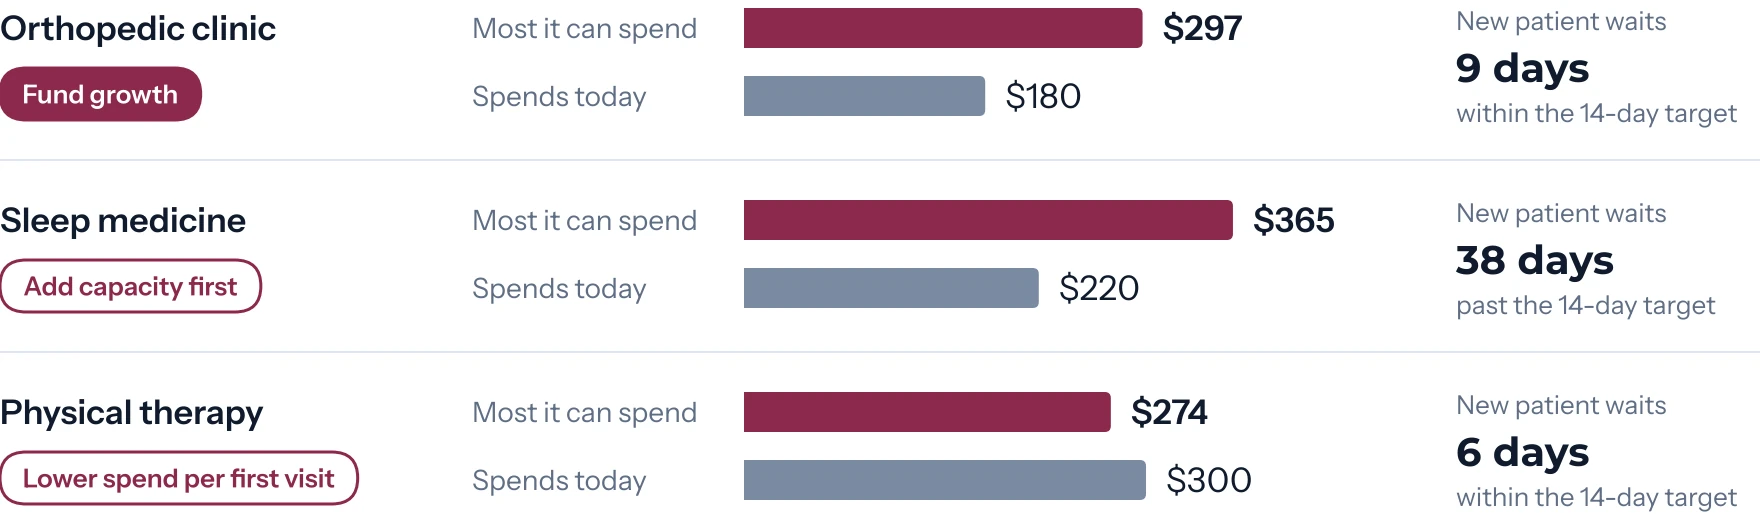
In that budget meeting, we would fund the orthopedic clinic’s campaign and take sleep medicine’s case for capacity to the staffing plan. Therapy’s short wait suggests open slots, where its next few patients cost far less. We would fill those first, then ask therapy for a lower spend per first visit.
The orthopedic and sleep calls hold by wide margins, while therapy’s call is close. A cost to serve about 4 percent lower, or a payment per visit about 3 percent higher, would reverse it. At the chain’s own payment per visit, therapy would rank second in dollars and earn back its spend. In a ten-visit line, each dollar per visit counts ten times.
What should the team decide this quarter?
Three decisions, in order.
- Rank service lines by contribution per new patient, each at the payer mix it serves today. Use patients who started a year ago, what each payer actually paid and the cost to serve, clinician time included.
- Set the most each line can spend to win a new patient. Compare it with campaign spend per first visit today, and remember the next patient often costs more to win.
- Fund marketing where the schedule has room. Where new patients wait past target, fund access first.
The inputs often sit in four places. Practice management holds visits and payers, cost accounting holds costs, marketing tools hold spend, and intake records how each patient found you. Your privacy team decides how patient records and marketing data meet.
On Monday, ask the team three questions. Which report shows contribution per new patient by line, with clinician time counted? Can intake tie each new patient to the campaign that brought them? How long does a new patient wait in each line, against its target?
Until those answers sit side by side, the next budget will likely follow volume or revenue.
The first step is a conversation about your growth plan. Bring what you have of last year’s marketing spend, payer mix, cost per visit and new-patient waits, as totals for each service line. We look at them as this piece does, through contribution per new patient, the most each line can spend and room on the schedule.
At jscTEK, we understand how healthcare buyers decide. See what we build on our Work page.
Sources
- Commercial payment relative to Medicare. Medicare Payment Advisory Commission (MedPAC), Report to the Congress: Medicare Payment Policy, March 2026, chapter 4, “Physician and other health professional services.” In 2024, PPO plans of one large national insurer paid, on average, 147 percent of fee-for-service Medicare’s rates for clinician services, up from 140 percent in 2023; the ratio varied by type of service. Accessed October 25, 2026.
- Medicaid fees relative to Medicare. KFF State Health Facts, “Medicaid-to-Medicare Fee Index,” from Laura Skopec, Avani Pugazhendhi and Stephen Zuckerman, Urban Institute, May 2025, which put the index for all services at 0.75 in 2024. The index compares fee-for-service Medicaid fees with Medicare fees, so Medicaid managed care payments fall outside it. The two averages differ in payer scope, measure and service weights, so the piece reports each against Medicare. Accessed October 25, 2026.
- The average wait for a new-patient appointment. AMN Healthcare, “The Growing Challenges With Physician Appointment Wait Times,” June 30, 2025, on its 2025 Survey on Physician Appointment Wait Times, which found an average of 31 days across 15 major metro areas in six medical specialties. Accessed October 25, 2026.
- How groups moved access in 2026. Chris Harrop, MGMA Stat, “New-patient wait times largely hold flat in 2026 as some groups add providers in bid to meet demand,” July 15, 2026, a July 14, 2026 poll with 197 applicable responses. In it, 46 percent of medical groups reported new-patient waits unchanged year to date, 28 percent longer and 22 percent shorter. Practices that hired landed in all three outcome groups, and MGMA wrote that what varied was demand. It lists the third next available appointment among the measures to track alongside new-patient waits. Accessed October 25, 2026.
- Therapy’s cost and payment per visit. U.S. Physical Therapy, Inc., “U.S. Physical Therapy Reports Fourth Quarter and Full Year 2024 Results,” Business Wire, February 26, 2025. For the 2024 fourth quarter it reported salaries and related costs of $63.00 per visit and a net rate of $104.73 per visit, and $104.71 for the full year. The case sets therapy’s cost to serve at $70 a visit, the $63.00 plus an assumed $7 for supplies and billing, and its payment works out to about $97 a visit. At the chain’s $104.71, therapy would contribute about $347, rank second in dollars and cover its $300 spend. In dollars, therapy ranks last only while its cost to serve stays above $67.63 a visit or its payment below $99.74; it covers its spend below a $67.38 cost or above a $100.00 payment, and ranks first below a $60.89 cost. At each of these points, therapy keeps the smallest share of its revenue. Accessed October 26, 2026.
- Therapy’s payer mix. U.S. Physical Therapy, Inc., Annual Report on Form 10-K for 2024, which reports that about 40.6 percent of visits and 36.0 percent of net patient revenue came from patients with Medicare or Medicaid coverage; managed care and commercial insurance made up 47.2 percent of revenue, workers’ compensation 10.1 percent and other payers 6.7 percent. By our arithmetic, visits covered by Medicare or Medicaid averaged about $93 and other visits about $113. The case gives therapy 50 percent Medicare and Medicaid visits and sets commercial therapy at 1.10 times Medicare, an assumption below the chain’s other payers as a group, which include workers’ compensation. Accessed October 26, 2026.
- Why the third open slot. Institute of Medicine, Transforming Health Care Scheduling and Access: Getting to Now, The National Academies Press, 2015, chapter 2, Box 2-1. The first and second available appointments often follow last-minute cancellations, so the third next available appointment best represents the access system as a whole. Accessed October 26, 2026.
- The chain’s 2024 quarters. U.S. Physical Therapy, Inc., first-quarter 2024 results, with salaries and related costs of $61.42 per visit; the second quarter, $59.66; and the third quarter, $62.47. With the fourth quarter’s $63.00, the year ran from $59.66 to $63.00, and the case uses the fourth quarter. Accessed October 26, 2026.